Something I didn’t know
I've studied financial markets and economics for nearly two decades. I've built models, sat through more earnings calls than I'd like to admit, and spent years in venture capital evaluating companies on the premise that growth and innovation drive returns. So when I stumbled across this, it genuinely caught me off guard.
The annualized total return of the S&P 500 from 1959 to 2025 is 10.48%. That's with dividends reinvested. The annualized growth in M2 money supply over the same period? 6.77%.
The spread is 3.7%.
I sat with that for a minute. Roughly 65% of S&P 500 returns are correlated with the growth in the money supply. Not earnings growth. Not innovation. Not productivity gains. Just the Fed expanding the monetary base. Money printer go burr, and your portfolio goes up. If you don't reinvest dividends, the spread drops to 0.5%. Half a percent. Over 66 years.
I went down the rabbit hole.
I pulled the full dataset from FRED, M2SL, the Federal Reserve's H.6 release, and paired it against S&P 500 total return data going back to 1959, which is as far back as the official M2 series goes. Then I broke it out by decade. That's where it gets interesting.
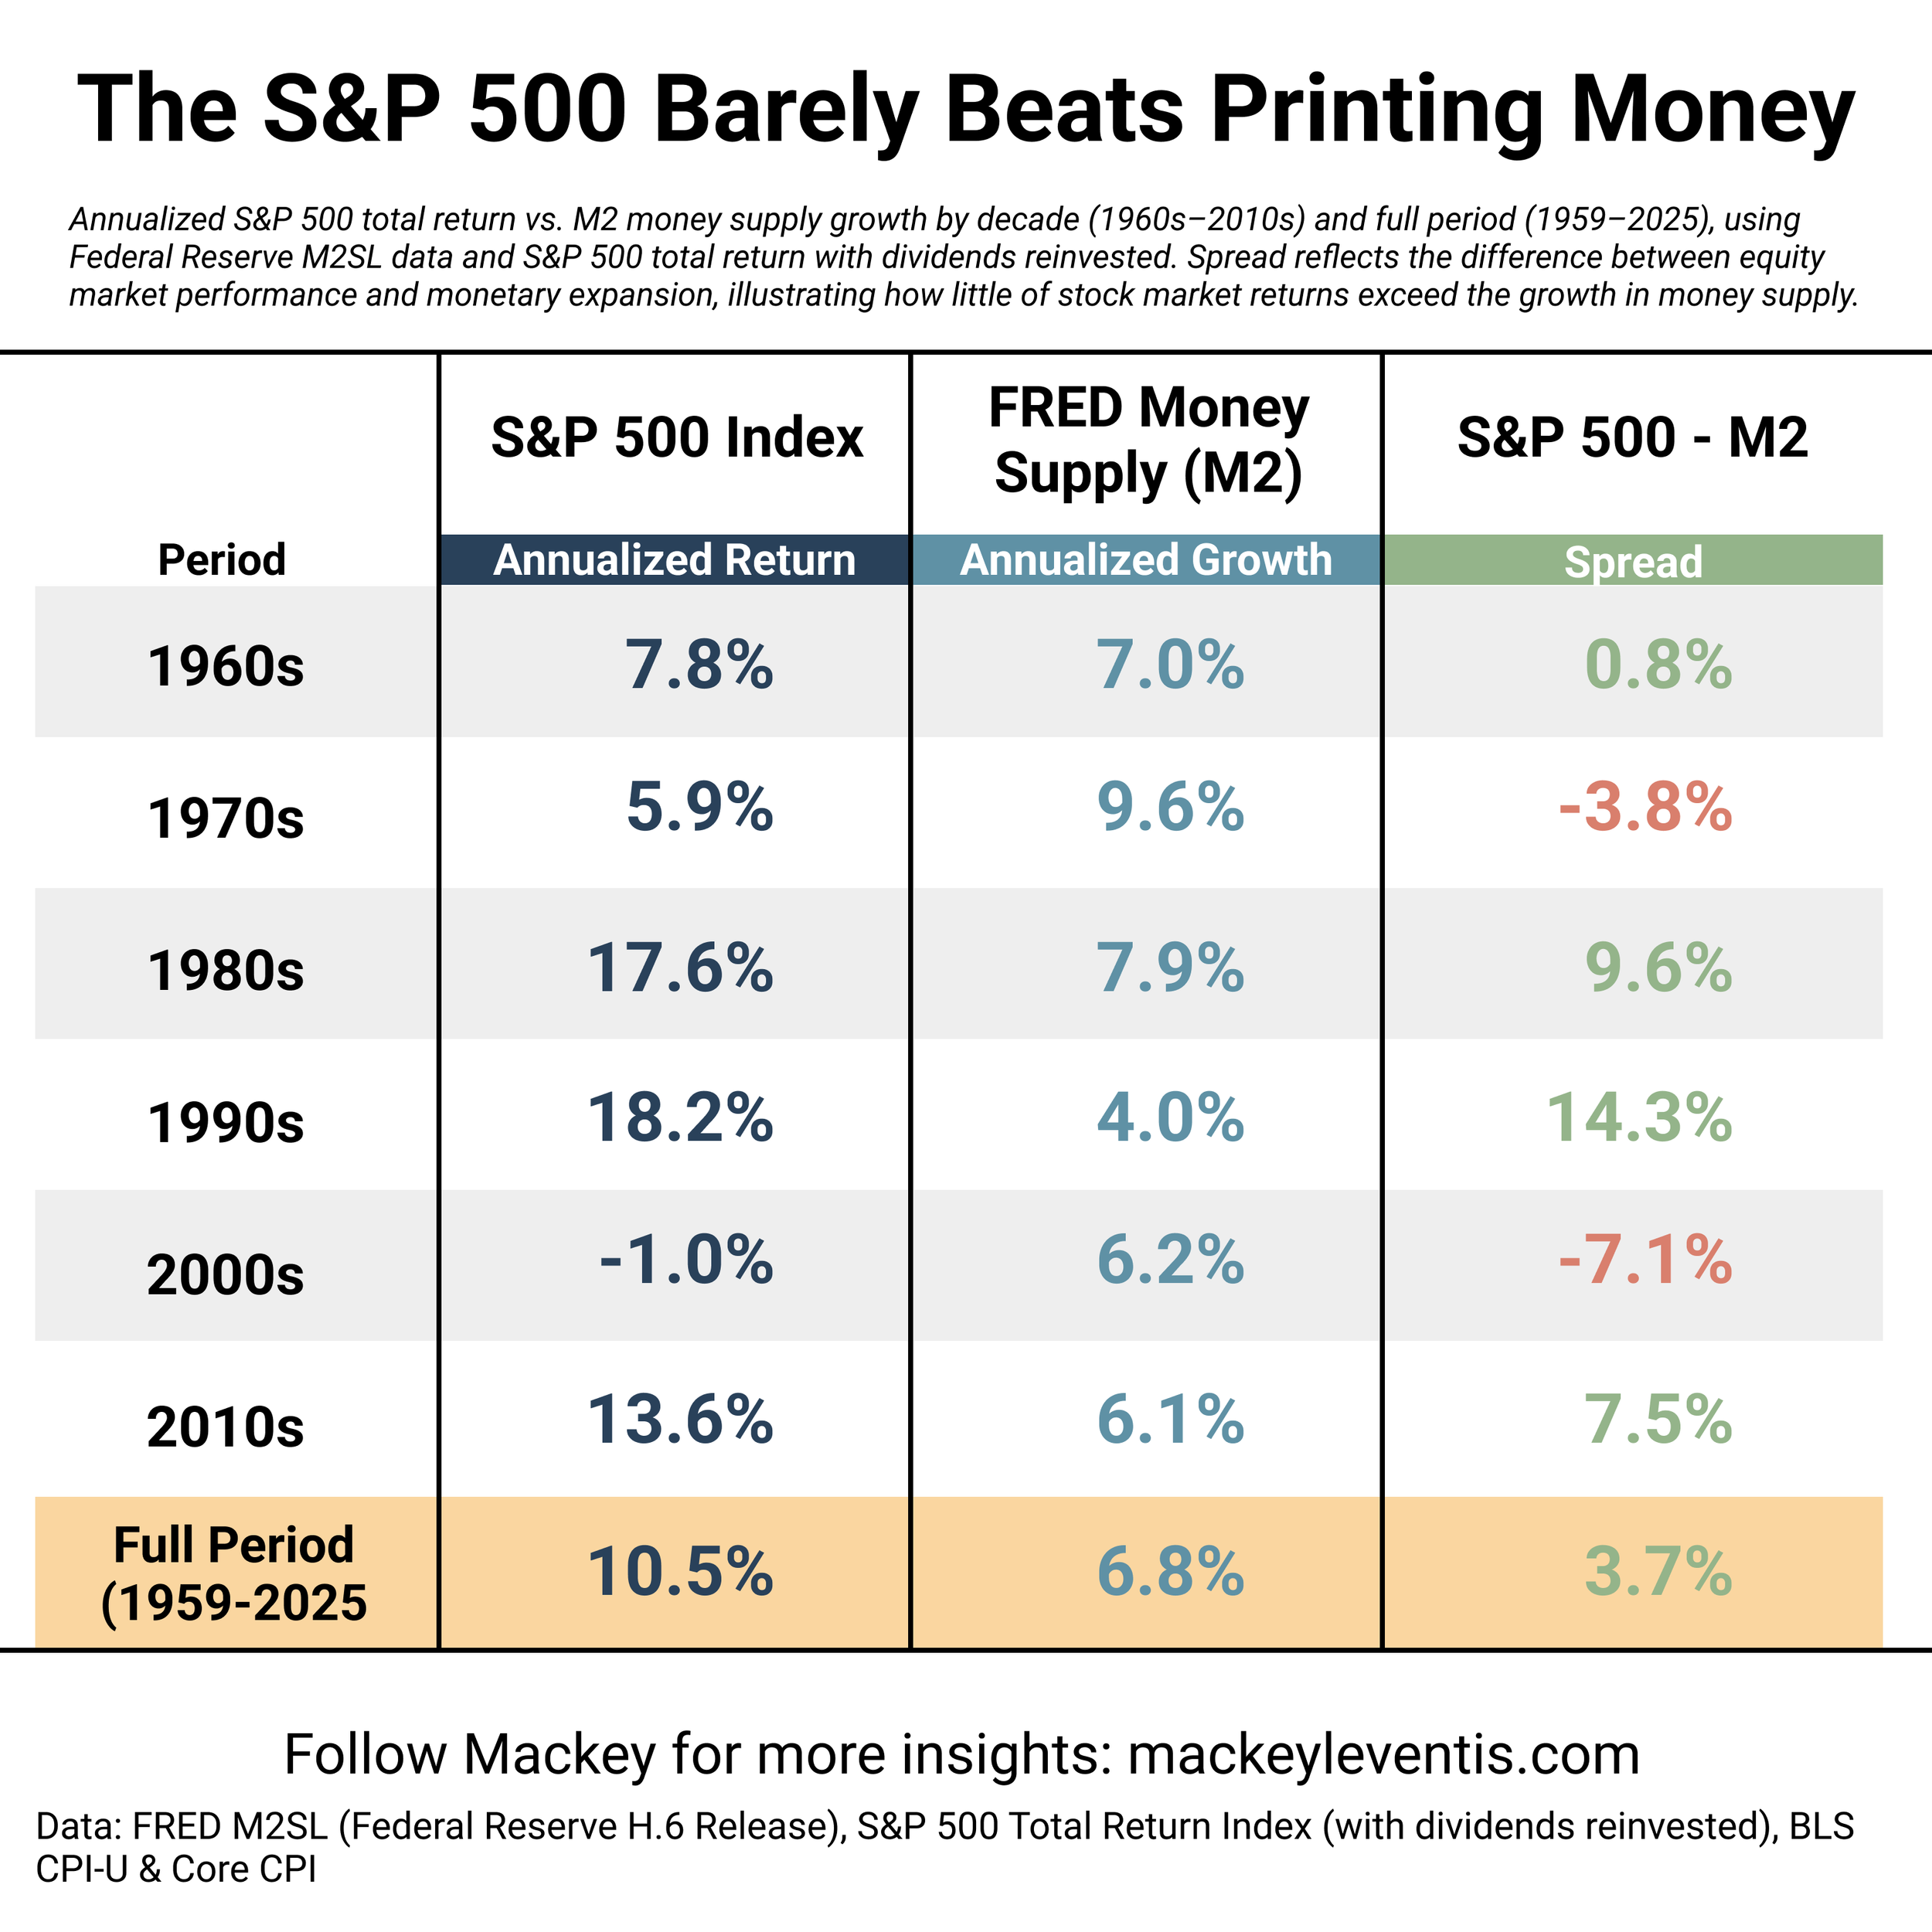
The 1970s: S&P returned 5.9%, M2 grew 9.6%. Spread of -3.8%. The money supply actually outpaced the stock market for an entire decade. Stagflation will do that.
The 1980s: S&P returned 17.6%, M2 grew 7.9%. Spread of 9.6%. Volcker broke inflation, rates came down, and equities ripped. This is the decade that created the modern bull market narrative.
The 1990s: S&P returned 18.2%, M2 grew 4.0%. Spread of 14.3%. The widest gap in the dataset. Greenspan kept M2 relatively tight while the economy boomed and the dot-com bubble inflated.
The 2000s: S&P returned -1.0%, M2 grew 6.2%. Spread of -7.1%. The lost decade. Two crashes, crisis-era money printing, and equities went backwards.
The 2010s: S&P returned 13.6%, M2 grew 6.1%. Spread of 7.5%. Post-GFC bull run, QE infinity, ZIRP. A lot of that equity return was the Fed reflating asset prices.
So the "real" return above monetary expansion swings wildly by decade. Sometimes it's 14%. Sometimes it's negative. But over the full period, it averages out to 3.7%. That's the number.
Then I looked at CPI.
Annualized headline CPI over the same period is 3.68%. Core CPI is 3.30%. So M2 grew at 6.77% while consumer prices only rose 3.68%. That's a ~3% annual gap between money supply growth and measured inflation, compounding for 66 years. Where did all that extra money go?
The textbook answer is velocity of money. MV = PQ. If M2 grows but velocity falls, prices don't have to rise proportionally. And velocity has been in secular decline since the early '90s — more money sitting in savings, money market funds, and bank reserves rather than circulating through the real economy.
But the more interesting answer, at least to me, is asset price absorption.
When new money enters the system, it doesn't flow evenly across the economy into consumer goods. It disproportionately flows into financial assets like stocks, bonds, real estate. CPI is designed to measure a basket of consumer goods and services. It structurally misses where most of the monetary expansion actually ends up. The 2010s are a clean example: M2 grew 6.1% annualized while CPI was only 1.8%, and meanwhile the S&P did 13.6%. The "missing" inflation wasn't missing. It was in your brokerage account.
There's a term for this, the Cantillon Effect. New money benefits those closest to its point of entry, which in the modern economy means financial institutions and asset holders, before eventually trickling out to the broader economy. The M2-CPI gap is basically a quantitative measure of the Cantillon Effect in action. The money wasn't missing. It was just showing up in asset prices instead of grocery bills.
Financial deepening plays a role too. Over time, a growing share of GDP is financial services, more wealth is held in financial instruments, and more transactions are financial rather than real-economy. That creates a structural wedge between money supply growth and consumer price inflation that widens over time.
I don't think any of this means you shouldn't invest in the S&P 500. It's still the best passive vehicle for most people. But it does reframe what you're actually getting when you buy the index. A meaningful chunk of that 10.5% annualized return isn't "growth" in any real sense, it's your portfolio keeping pace with monetary expansion. The part that's actually real wealth creation above and beyond the printing press? That's the 3.7%. Maybe that's enough. But I would have thought it'd be more.
The full dataset with decade breakdowns, CPI overlays, and the underlying calculations is in the chart above.